Site pages
Current course
 Participants
General
MODULE 1 :: Introduction & Warming up
MODULE 2 :: Developing competences
MODULE 3 :: Exploring e-learning
MODULE 4 :: Designing e-tivities
MODULE 5 :: Motivation
MODULE 6 :: Group work
MODULE 7 :: Moderation online forum discussion
MODULE 8 :: Developing e-learning resources
...Online resources - reusing, sharing and evaluating
MODULE 10 :: The role of the facilitator
10.3. Create a chart
Taking as a starting point the self-evaluation Questionnaire you filled in in Module 1 and in Activity 10.2, prepare two charts that visualise and compare your progress in the course. Publish the charts on the Module Forum together with a reflective commentary. How do you assess your progress? Which of the facilitating abilities have you developed best, which have you improved and which still need to be improved? Which activities in the course worked best in supporting your development? Which of the facilitating skills do you foresee as the most useful in teaching your vocational subject online?
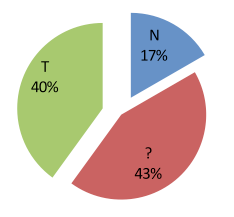
Example of the charts:
 |
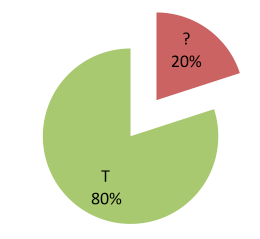 |
| Before the course | After the course |
The charts illustrate the percentage of replies of the course participant: “Yes” (T), “No” (N) and “I don’t know” (?) from the self-evaluation questionnaire which was done before and after the course.
Time for the task: 30 min